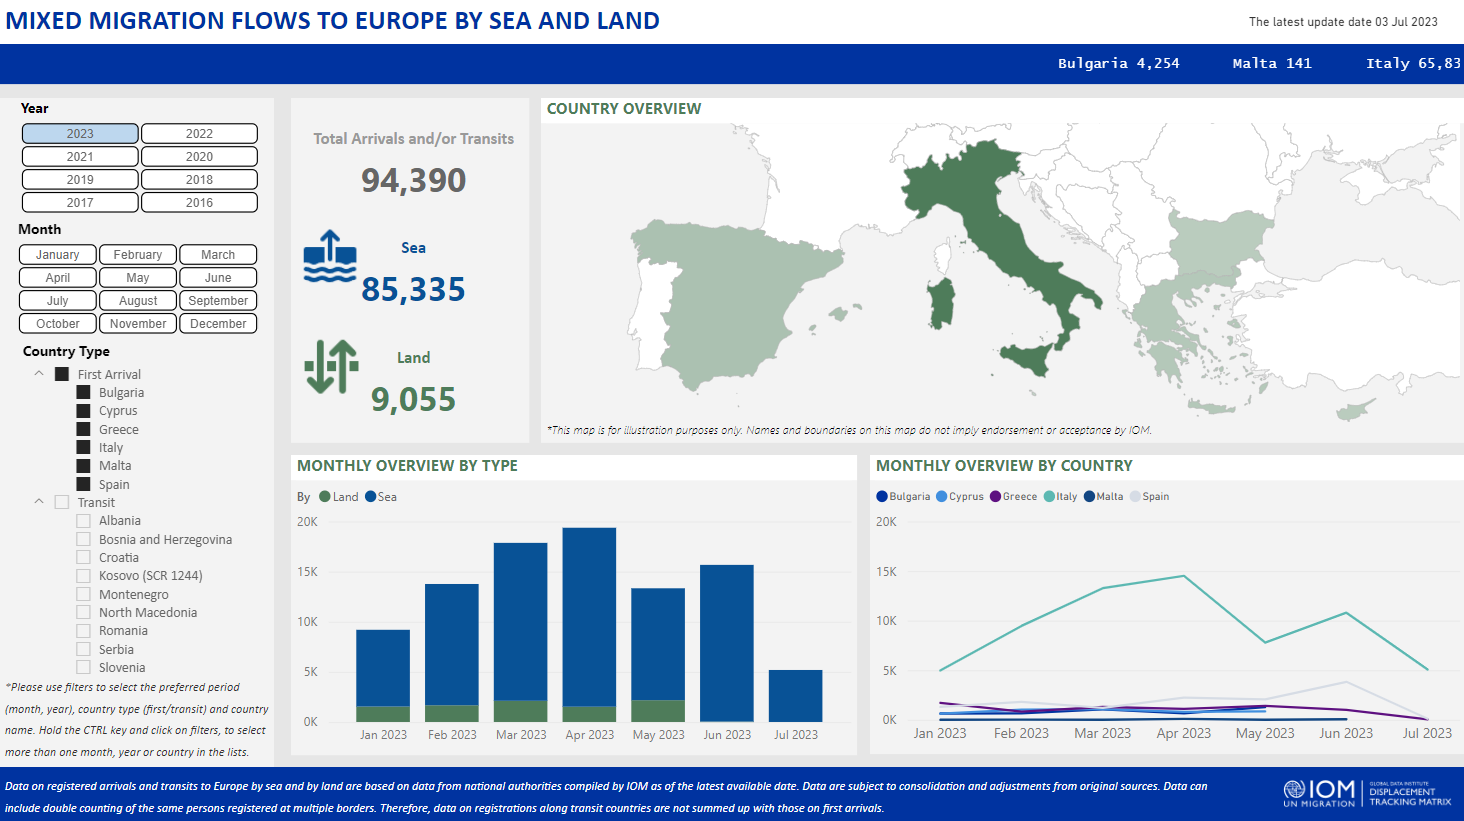
Europe Arrivals
Total Arrivals
Arrivals by Sea
Arrivals by Land
Dead and missing migrants to Europe
Trends over time: arrivals, death and missing migrants to Europe
| Year | Arrivals | Dead and Missing |
|---|
Monthly arrival by land and sea
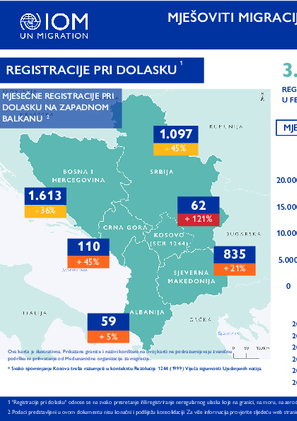
Mjesečni pregled:

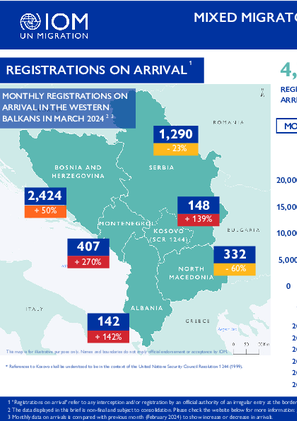
Monthly Overview of:
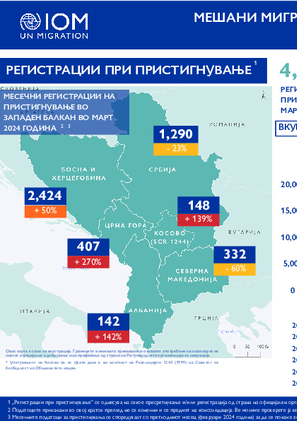
Месечен преглед на:
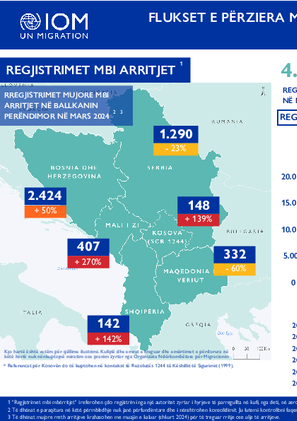
Përmbledhje mujore të:
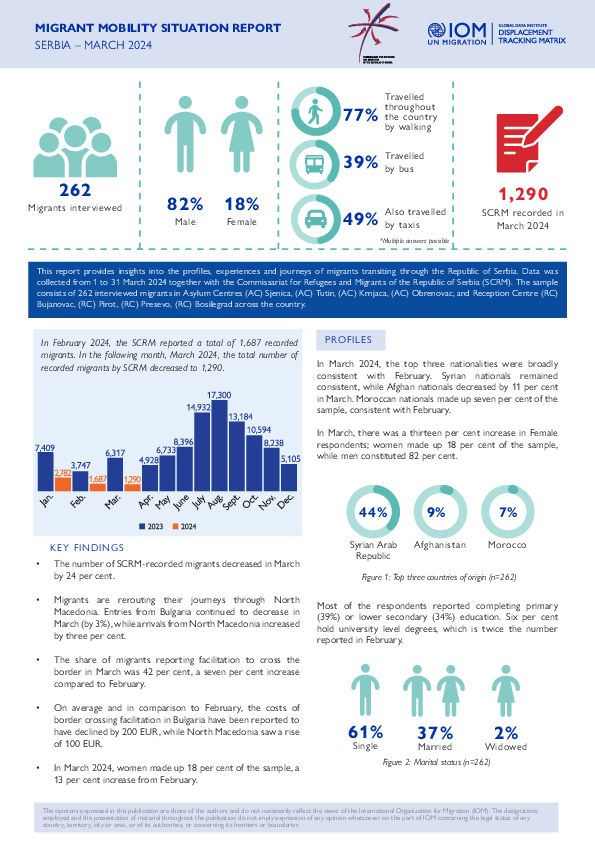
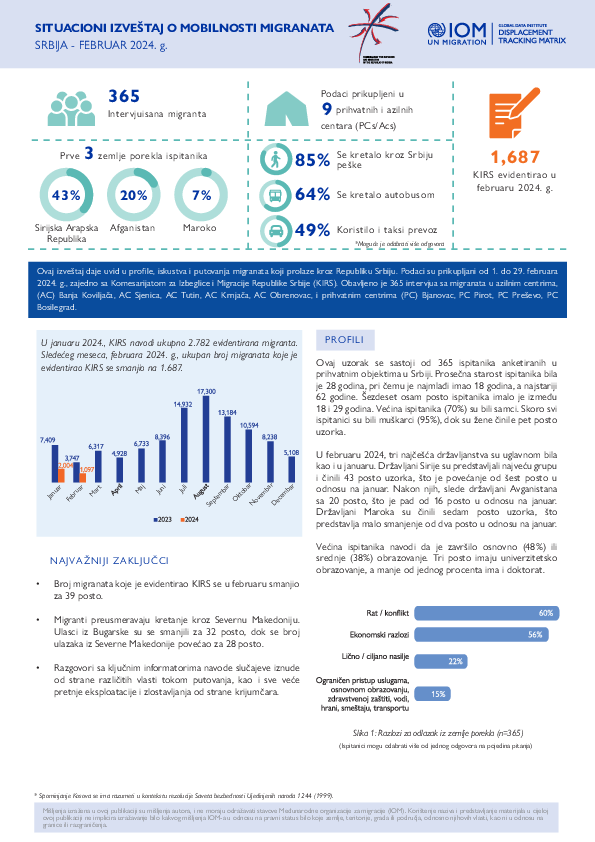
Ovaj izveštaj pruža uvid u profile, iskustva i putovanja migranata koji prolaze kroz Republiku Srbiju. Podaci su prikupljani od 1. do 31. marta 2024. godine u saradnji sa Komesarijatom za izbeglice i migracije Republike Srbije (Komesarijat). Uzorak čine 262 intervjuisana migranta.

This report presents the results of the second round of the Displacement Tracking Matrix (DTM) Flow Monitoring Surveys (FMS) implemented in Montenegro. The data was collected from 8 June to 28 August 2023. IOM interviewed a total of 126 respondents.
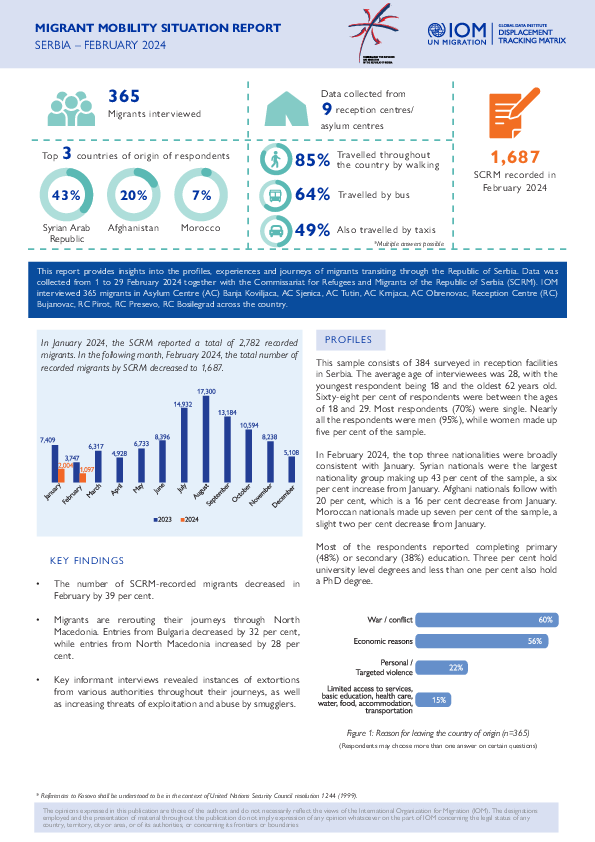
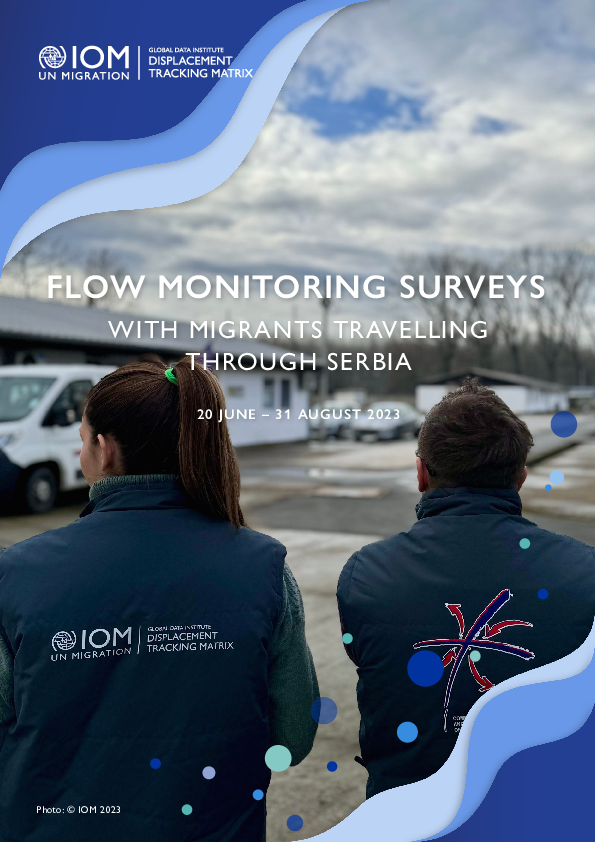
This report provides insights into the profiles, experiences and journeys of migrants transiting through the Republic of Serbia.
According to the latest available gures from the Turkish Presidency of Migration Management (PMM), there are more than 4.5 million foreign nationals present in Türkiye, 3.4 million of whom are seeking international protection.

DTM Europe gathers, validates and disseminates information on migrants and refugees travelling through the Mediterranean, Western African Atlantic, and Western Balkan routes to Europe.
This report provides insights into the profiles, experiences, needs, routes travelled and intentions of migrants transiting through the Western Balkans.

This report presents the results of the second round of the Displacement Tracking Matrix (DTM) Flow Monitoring Surveys (FMS) collected in Kosovo* from 3 July to 30 August 2023. IOM interviewed a total of 51 individual respondents. The first round of FMS was carried out in June and July 2022.

This report, based on a multi-method and multi-source approach, provides insights into the profiles, experiences and journeys of migrants transiting through the Republic of Serbia.
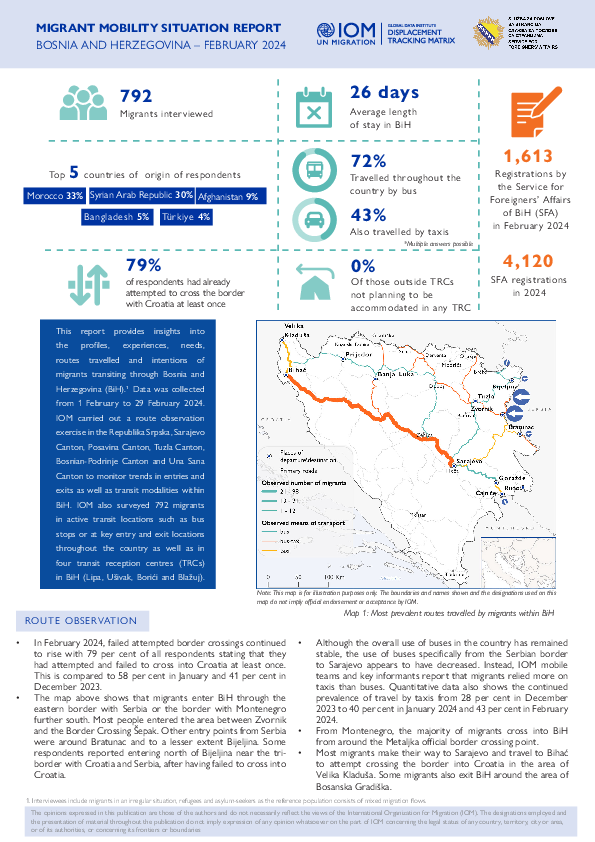
This report, based on a multi-method and multi-source approach, provides insights into the profiles, experiences, needs, routes travelled and intentions of migrants transiting through Bosnia and Herzegovina.
This report, based on a multi-method and multi-source approach, provides insights into the profiles, experiences and journeys of migrants transiting through the Republic of Serbia.
This report, based on a multi-method and multi-source approach, provides insights into the profiles, experiences, needs, routes travelled and intentions of migrants transiting through Bosnia and Herzegovina.

Përmbledhje mujore të:
Месечен преглед на:
Monthly Overview of:

Mjesečni pregled:
This report presents the results of the third round of the Displacement Tracking Matrix (DTM) Flow Monitoring Surveys (FMS) implemented in Serbia. FMS provides a snapshot of the profiles, experiences and needs of migrants residing in reception centres in Serbia.
According to the latest available figures from the Turkish Presidency of Migration Management (PMM), there are more than 4.5 million foreign nationals present in Türkiye, 3.4 million of whom are seeking international protection.

This profile provides information on the situation and vulnerabilities of Sudanese migrants in Libya, including those having arrived after the onset of conflict in mid-April 2023 and provides an update to a brief published in
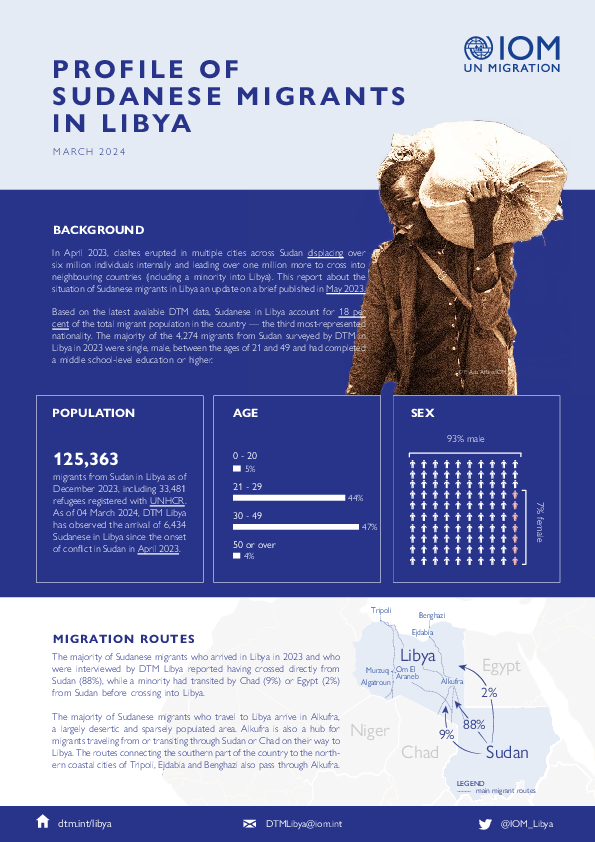
IOM Libya’s Displacement Tracking Matrix (DTM) programme identified a total of 706,509 migrants from 45 nationalities in the 100 Libyan municipalities during round 50 of data collection (October - December 2023). The number of migrants in Libya increased slightly compared to the previous round of
This report provides insights into the profiles, experiences and journeys of migrants transiting through the Republic of Serbia. Data was collected from 1 to 31 January 2024 together with the Commissariat for Refugees and Migrants of the Republic of Serbia (SCRM).

Europe — Mixed Migration Flows to Europe, Yearly Overview (2023)
Mar 19 2024
<p>The file contains the following sheets</p><figure class="table"><table><tbody><tr><td><strong>Sheet</strong></td><td><strong>Content</strong></td><td><strong>Countries and Areas</strong…
Europe — Mixed Migration Flows to Europe, Quarterly Overview Dataset (July - September 2023)
Dec 05 2023
Flow Monitoring is a component of DTM and it is used to track population movements inside a country, within a region or across regions.
Europe — Mixed Migration Flows to Europe, Quarterly Overview Dataset (April - June 2023)
Sep 05 2023
Flow Monitoring is a component of DTM and it is used to track population movements inside a country, within a region or across regions.
Europe — Mixed Migration Flows to Europe, Quarterly Overview (Jan - Mar 2023)
May 22 2023
Flow Monitoring is a component of DTM and it is used to track population movements inside a country, within a region or across regions. The dataset includes: - monthly and daily figures on arrivals by sea and by land to Europe (Bulgaria, Cyprus, Greece, Italy, Malta, Spain) - monthly and…
Europe — Mixed Migration Flows to Europe, Quarterly Overview (Oct - Dec 2022)
Feb 28 2023
Flow Monitoring is a component of DTM and it is used to track population movements inside a country, within a region or across regions. The dataset includes: - monthly and daily figures on arrivals by sea and by land to Europe (Bulgaria, Cyprus, Greece, Italy, Malta, Spain) - monthly and daily…
Europe — Mixed Migration Flows to Europe, Quarterly Overview (July- September 2022)
Dec 01 2022
Flow Monitoring is a component of DTM and it is used to track population movements inside a country, within a region or across regions. The dataset includes: - monthly and daily figures on arrivals by sea and by land to Europe (Bulgaria, Cyprus, Greece, Italy, Malta, Spain) - monthly and…
Europe — Mixed Migration Flows to Europe, Quarterly Overview (Apr - Jun 2022)
Aug 16 2022
Flow Monitoring is a component of DTM and it is used to track population movements inside a country, within a region or across regions. The dataset includes: - monthly and daily figures on arrivals by sea and by land to Europe (Bulgaria, Cyprus, Greece, Italy, Malta, Spain) - monthly and daily…
Europe — Mixed Migration Flows to Europe, Quarterly Overview (Jan - Mar 2022)
May 24 2022
Flow Monitoring is a component of DTM and it is used to track population movements inside a country, within a region or across regions. The dataset includes: - monthly and daily figures on arrivals by sea and by land to Europe (Bulgaria, Cyprus, Greece, Italy, Malta, Spain) - monthly and daily…
Europe — Mixed Migration Flows to Europe, Quarterly Overview (October - December 2021)
Feb 16 2022
Flow Monitoring is a component of DTM and it is used to track population movements inside a country, within a region or across regions. The dataset includes: - monthly and daily figures on arrivals by sea and by land to Europe (Bulgaria, Cyprus, Greece, Italy, Malta, Spain) - monthly and…
Europe — Mixed Migration Flows to Europe, Quarterly Overview (July - September 2021)
Nov 12 2021
Flow Monitoring is a component of DTM and it is used to track population movements inside a country, within a region or across regions. The dataset includes: - monthly and daily figures on arrivals by sea and by land to Europe (Bulgaria, Cyprus, Greece, Italy, Malta, Spain) - monthly and daily…
Europe — Mixed Migration Flows to Europe, Quarterly Overview (April - June 2021)
Aug 27 2021
Flow Monitoring is a component of DTM and it is used to track population movements inside a country, within a region or across regions. The dataset includes quarterly data and yearly consolidated series for arrivals, transits, nationalities and migrant presence in reception for the covered…
Europe — Mixed Migration Flows to Europe, Quarterly Overview (January - March 2021)
May 04 2021
Flow Monitoring is a component of DTM and it is used to track population movements inside a country, within a region or across regions.